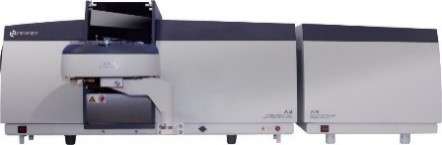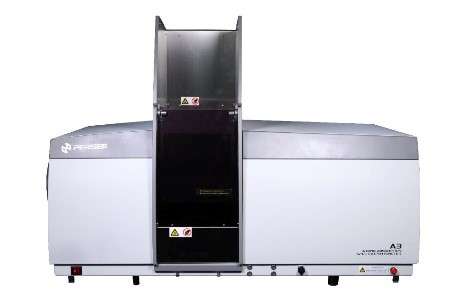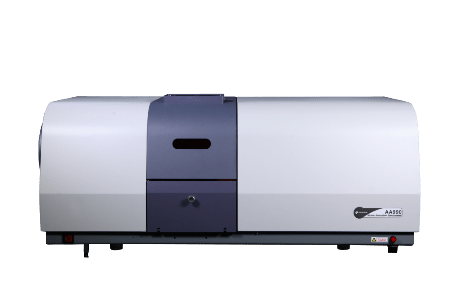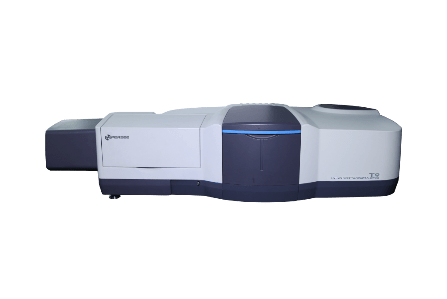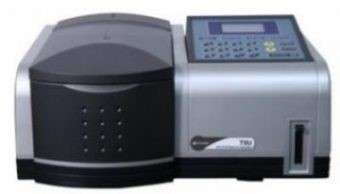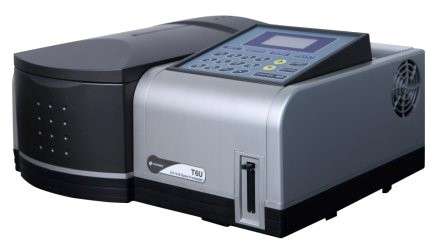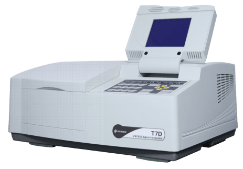
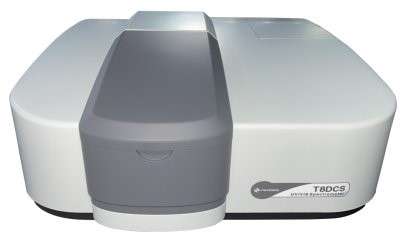
T8DCS UV-Vis
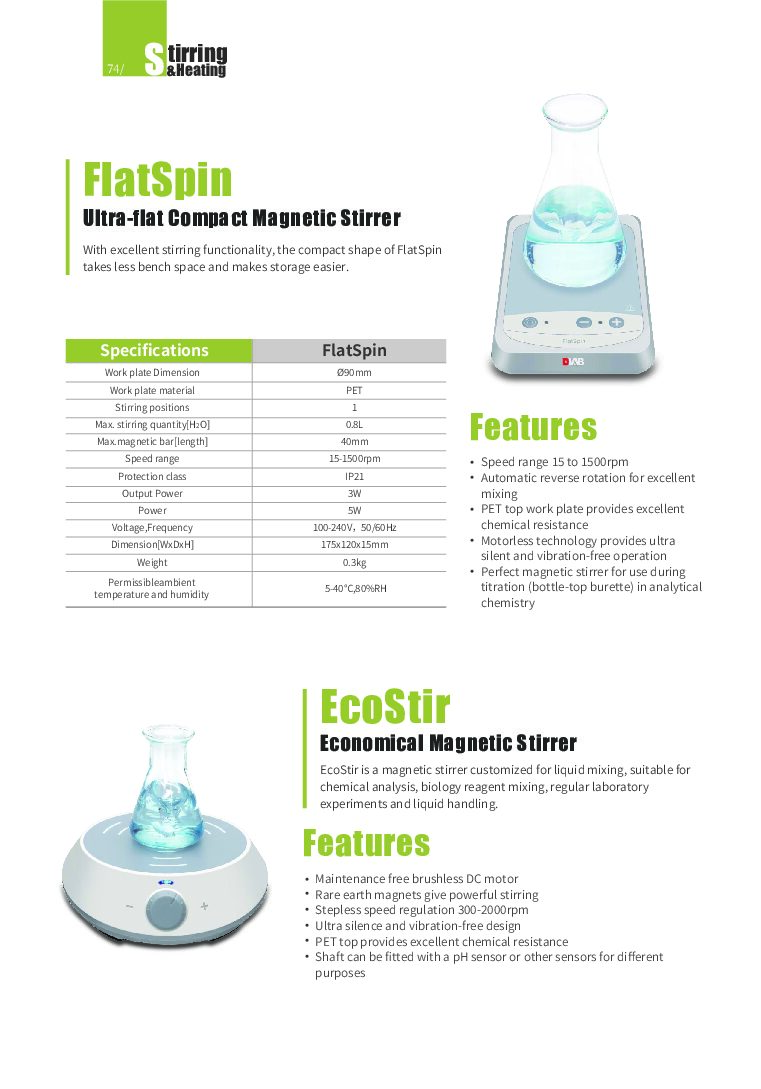
T8DCS is a high performance double beam spectrophotometer with a continuously selectable spectral bandwidth from 0.1-5nm.
It meets various demands for spectral bandwidth from users in different industries especially pharmaceutical industry and scientic research field.
The Czerny-Turner Monochromator with a holographic grating keeps stray light to a minimum and offers excellent optical resolution.
The use of a photomultiplier tube as detector delivers exceptional sensitivity.
The T8DCS’ true double-beam optical system coupled with an efficient and well proven electronic control system ensures high stability and low background noise.
| Product Name | T8DCS UV-Vis
|
| Product Description | T8DCS is a high performance double beam spectrophotometer with a continuously selectable spectral bandwidth from 0.1-5nm.
It meets various demands for spectral bandwidth from users in different industries especially pharmaceutical industry and scientic research field. The Czerny-Turner Monochromator with a holographic grating keeps stray light to a minimum and offers excellent optical resolution. The use of a photomultiplier tube as detector delivers exceptional sensitivity. The T8DCS’ true double-beam optical system coupled with an efficient and well proven electronic control system ensures high stability and low background noise. |
| Features | Photomultiplier tube detection provides exceptional sensitivity
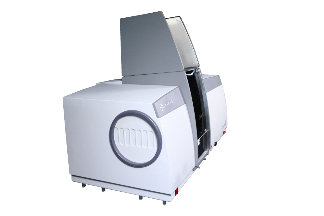
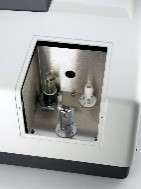
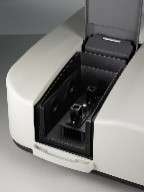
Wavelength accuracy +0.3nm (Automatic Wavelength Correction) User selectable spectral bandwidth between 0.1-5nm User friendly design allows easy light source replacement and routine maintenance Sample compartment design enables use of a wide range of optional accessories UV-Win software offers many operational and data processing capabilities and is supplied as standard with the T8DCS |
| Principle | The spectral bandwidth is one of the main factors that affect the quantitative analysis error of UV/Vis Spectrophotometer. After studying the influences of spectral bandwidth on the analysis error, T. Owen pointed out that the spectral bandwidth of the UV/Visible Spectrophotometer is very important. When the spectral bandwidth (SBW) / natural bandwidth (NBW) ≤ 0.1 (natural bandwidth, which is half width of the sample absorp
tion band), the instrument can meet the requirements of 99% sample analysis , and analysis accuracy can reach up to 99.9%. Below is an application example in drug inspection industry: As we can see, the peak value is the highest when the spectral bandwidth is 0.4nm, indicating that the best spectral bandwidth is 0.4nm. In addition, the most suitable spectral bandwidth for drugs, such as Penicillin Potassium and Cytochrome C solution, can be found through experiments. Thus reduce the measurement steps, reduce testing costs, and save measurement time. The T8DCS features an advanced continuous variable bandwidth and excellent performance. It meets various demands for spectral bandwidth from users in different industries especially pharmaceutical industry and scientific research field.
|
| Application | Biotech & life science: clinical analysis, disease control analysis, micro-sample testing in the field of life, human biochemical index analysis, metabolite analysis, test the micro samples of life science and provide DNA/Protein detector to measure the DNA/Protein concentration etc.
Environmental monitoring & control: Monitoring of water quality, atmospheric pollution, rainfall and soil contamination. Food & Beverage production and quality control: Analysis of additives preservatives and flavors, fat contents, enzyme, glucose, flavoring, minerals, vitamins, etc. Agricultural monitoring: Can be applied in various agriculture, such as pesticide detection, crop analysis, animal medicine analysis, fertilizer inspection, soil analysis, animal food stocks inspection etc. Geology & Metallurgy: Determination of metallic elements and inorganic salt in minerals. Clinical & forensic analysis: Measuring the change in absorbance of turbid biological samples can be challenging as the inherent background absorbance of the sample may be over 4 Abs Education in universities and colleges: Determination of complex composition, Obtaining kinetics curves, acid-base dissociation constant, photometric titration, etc.
|
.png)
.png)
.png)
.png)
.png)
.png)
.png)


.png)
1.png)

.png)
1.png)
.png)
1.png)
.png)
1.png)
.png)
1.png)
.png)
.png)