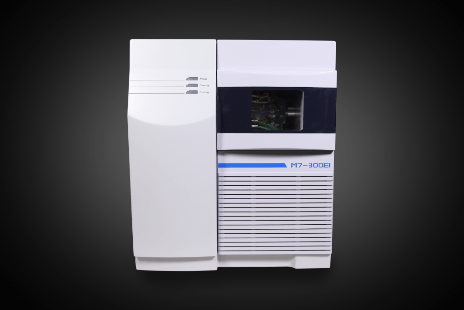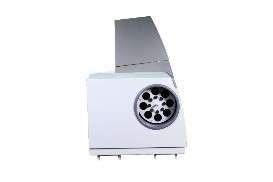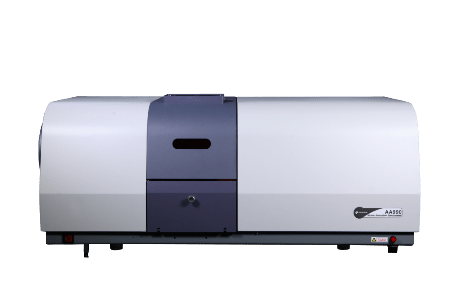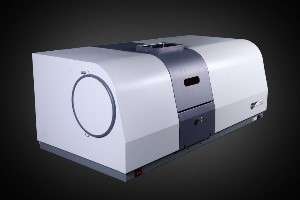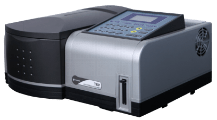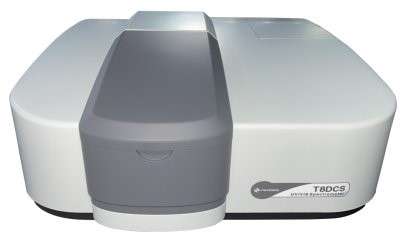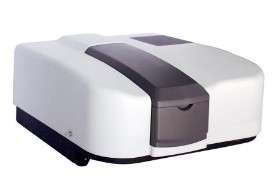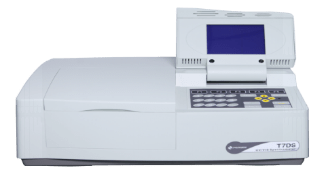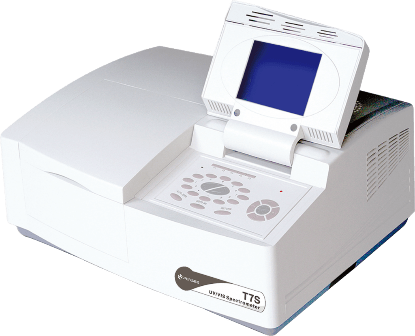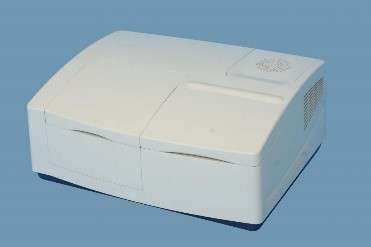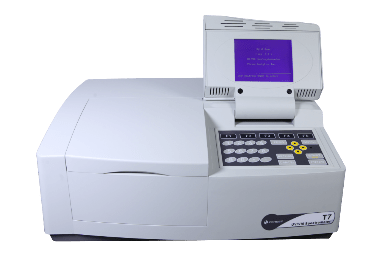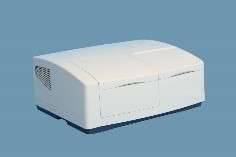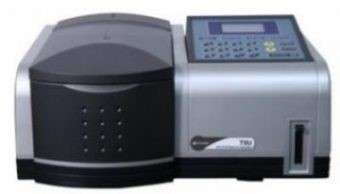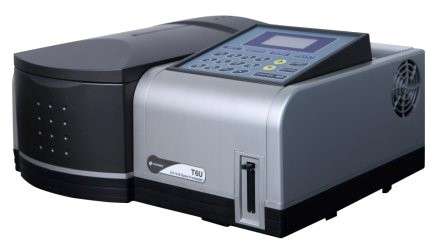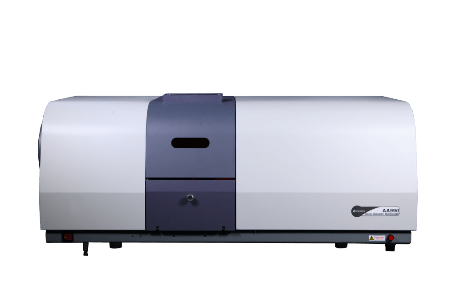
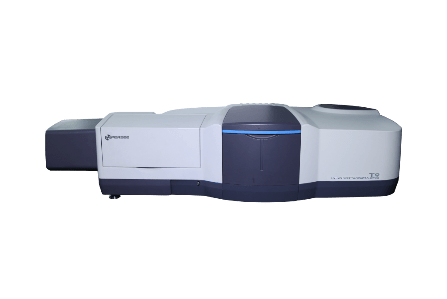
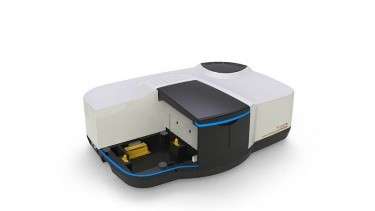
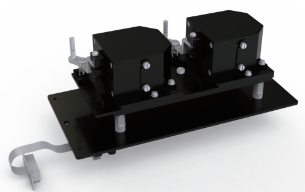
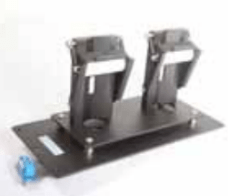
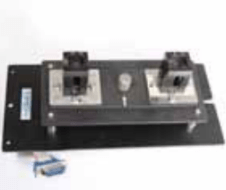
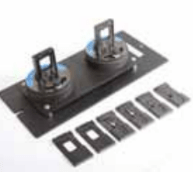
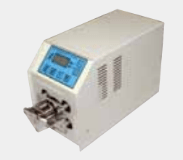
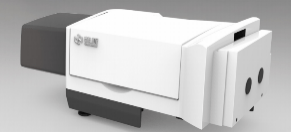
T10DCS UV-Vis
The optical design of T9DCS offers extremely low stray light characteristics (≤0.00004%T NaI,220 nm) which allow for an extensive photometric range (-8.0 – 8.0Abs).
Measurements at deep ultra-violet wavelengths can also be achieved with the use of Nitrogen purged optics.
The instrument can be optically configured to suit the needs of the sample using a continually adjustable slit for precise control of spectral resolution and beam size adjustment using an attenuating wheel.
Precise wavelength accuracy is ensured by the integrated Mercury Emissions Lamp used for automatic correction of spectral deviation.
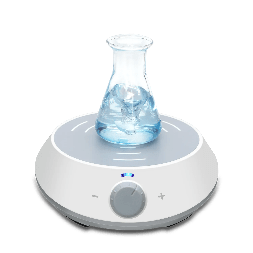
| Product Name | T10DCS UV-Vis
|
| Product Description | The optical design of T9DCS offers extremely low stray light characteristics (≤0.00004%T NaI,220 nm) which allow for an extensive photometric range (-8.0 – 8.0Abs).
Measurements at deep ultra-violet wavelengths can also be achieved with the use of Nitrogen purged optics. The instrument can be optically configured to suit the needs of the sample using a continually adjustable slit for precise control of spectral resolution and beam size adjustment using an attenuating wheel. Precise wavelength accuracy is ensured by the integrated Mercury Emissions Lamp used for automatic correction of spectral deviation. |
| Features |
|
| Principle | The choice of measuring wavelength
Normally taking the wavelength which has the most absorbance as the measuring wavelength (λ max) to attain the highest analysis sensitivity is called the most absorbance principle. And the absorbance will change a little along with wavelengths changing around the λ max, so we can get better precision. But we would like to take the low sensitivity measuring wavelength as the absorption peak wavelength when measuring high-concentration compounds, to guarantee the corrective curve has enough linear range. If the absorption peak in the wavelength λ max is too thin, we can adopt a little lower sensitivity wavelength to measure the condition that satisfies the need for analysis sensitivity, which is to decrease the deviation of Beer’s Law. The choice of absorbance range Because of the unstable light source, inaccuracy of reading, or alternation of lab conditions in the measurement, any photometer has some measuring error. Because the transmittance T in the absorbance law is negative logarithm to the concentration C, from the curve of negative logarithm we can see, the relative error of the same transmittance in different concentrations is different. The relative error is very big when the concentration is too high or too low, so we should choose the proper absorbance range to decrease the relative error of the result. In practice, we can adjust the concentration of the solution or the length of the cell to make the absorbance in the required range. The choice of bandwidth Bandwidth will affect the sensitivity of measurement and the linear range of the correction curve. If the bandwidth is too wide, the monochromatic light of incidence will be less, the correction curve will deviate from Beer’s Law, and the sensitivity will be lower. If the bandwidth is too thin, the gain of the instrument will be very high, the noise will increase, and it’s not good for measurement. Measure the deviation of absorbance along with the bandwidth to choose the proper one. The absorbance will not change if the bandwidth is in a range, but the absorbance will decrease if the bandwidth is as wide as some level. So the widest bandwidth which does not decrease the absorbance is the proper one we should choose. |
| Application | Biotech & life science: clinical analysis, disease control analysis, micro sample testing in the field of life, human biochemical index analysis, metabolite analysis, test the micro samples of life science and provide DNA/Protein detector to measure the DNA/Protein concentration etc.
Environmental monitoring & control: Monitoring of water quality, atmospheric pollution, rainfall and soil contamination. Food & Beverage production and quality control: Analysis of additives preservatives and flavours, fat contents,enzyme, glucose, flavouring, minerals, vitamins, etc. Agricultural monitoring: Can be applied in various agriculture, such as pesticide detection, crop analysis, animal medicine analysis, fertilizer inspection, soil analysis, animal food stocks inspection etc. Geology & Metallurgy: Determination of metallic elements and inorganic salt in minerals. Clinical & forensic analysis: Measuring the change in absorbance of turbid biological samples can be challenging as the inherent background absorbance of the sample may be over 4 Abs Education in universities and colleges: Determination of complex composition, Obtaining kinetics curves, acid-base dissociation constant, photometric titration, etc. Metrology verification: Can be used for standard material verification and calibration, such as standard filters, potassium dichromate standard solutions, etc.
|
.png)
.png)
.png)
.png)
.png)
.png)
.png)


.png)
1.png)


.png)
1.png)
.png)
1.png)
.png)
1.png)
.png)
1.png)
.png)
.png)